Plots
This notebook presents some example of possible plots you can make using the package.
First, import the package
In [1]:
import dvb.datascience as ds
C:\ProgramData\Anaconda3\lib\site-packages\deap\tools\_hypervolume\pyhv.py:33: ImportWarning: Falling back to the python version of hypervolume module. Expect this to be very slow.
  "module. Expect this to be very slow.", ImportWarning)
C:\ProgramData\Anaconda3\lib\importlib\_bootstrap_external.py:426: ImportWarning: Not importing directory C:\ProgramData\Anaconda3\lib\site-packages\mpl_toolkits: missing __init__
  _warnings.warn(msg.format(portions[0]), ImportWarning)
C:\ProgramData\Anaconda3\lib\importlib\_bootstrap_external.py:426: ImportWarning: Not importing directory c:\programdata\anaconda3\lib\site-packages\mpl_toolkits: missing __init__
  _warnings.warn(msg.format(portions[0]), ImportWarning)
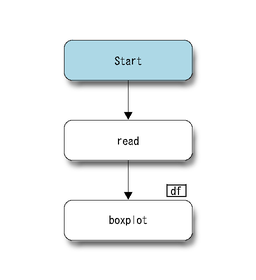
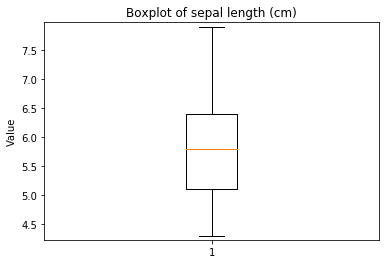
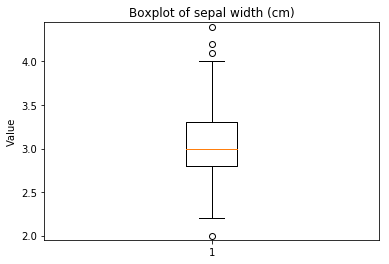
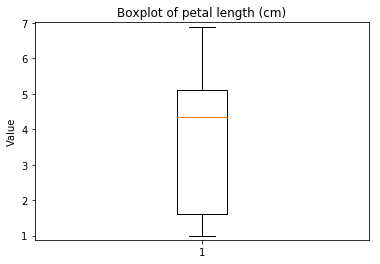
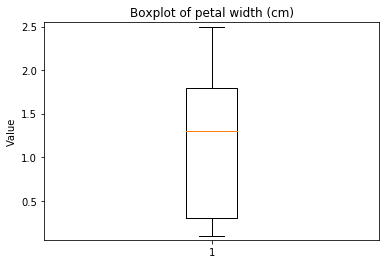
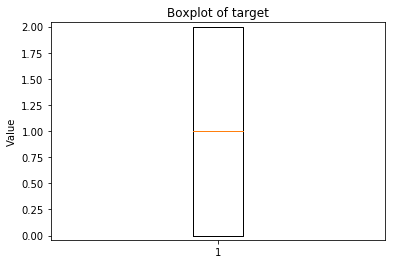
Boxplots
In [2]:
p = ds.Pipeline()
p.addPipe('read', ds.data.SampleData('iris'))
p.addPipe('boxplot', ds.eda.BoxPlot(), [("read", "df", "df")])
p.transform(name="boxplot_example", close_plt=True)
'Drawing diagram using blockdiag'
Transform boxplot_example
Boxplots Transform boxplot_example
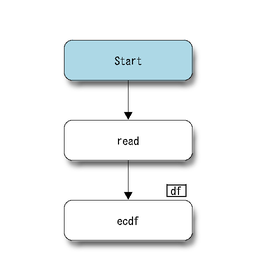
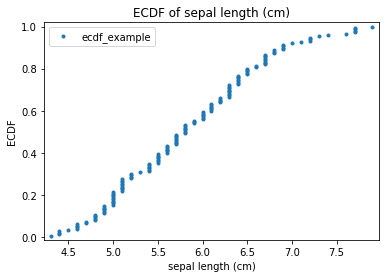
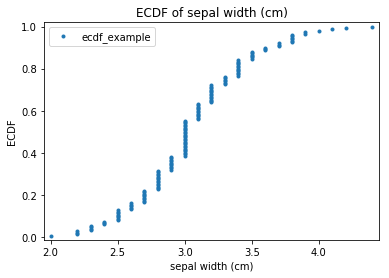
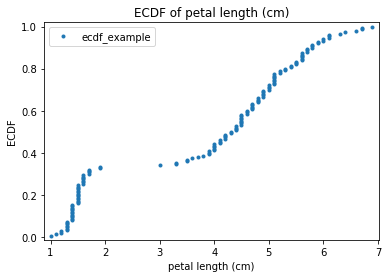
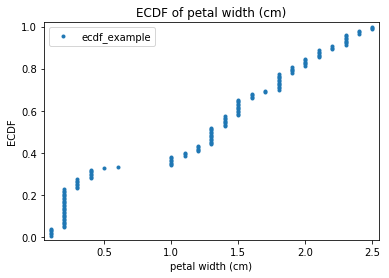
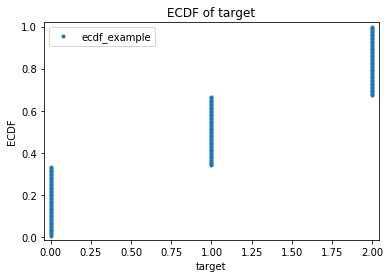
ECDF plots
In [3]:
p = ds.Pipeline()
p.addPipe('read', ds.data.SampleData('iris'))
p.addPipe('ecdf', ds.eda.ECDFPlots(), [("read", "df", "df")])
p.transform(name="ecdf_example", close_plt=True)
'Drawing diagram using blockdiag'
Transform ecdf_example
ECDF Plots Transform ecdf_example
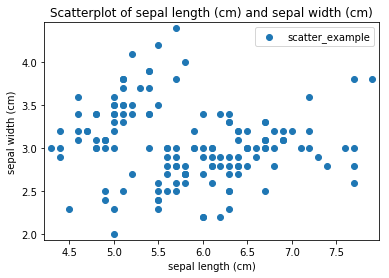
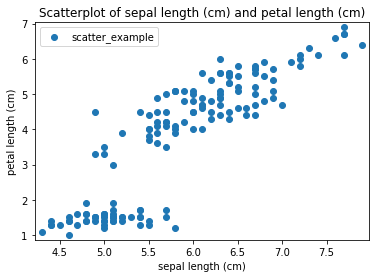
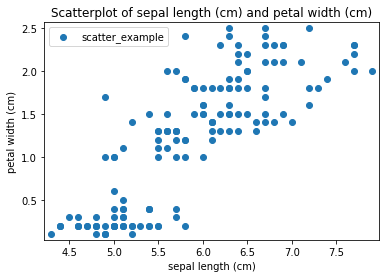
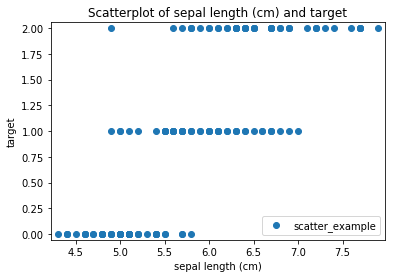
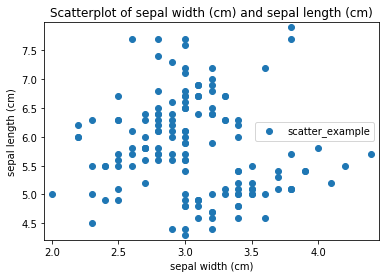
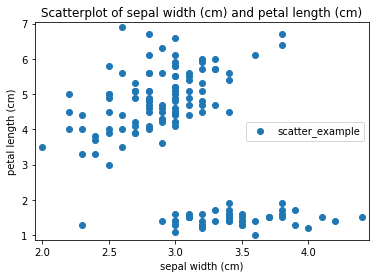
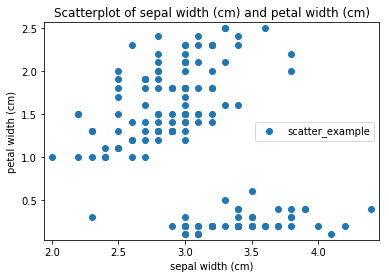
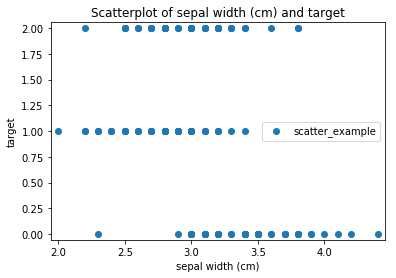
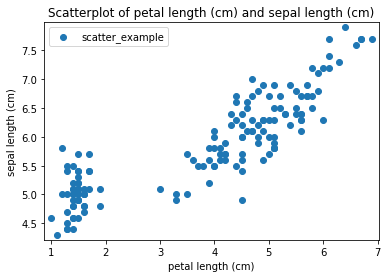
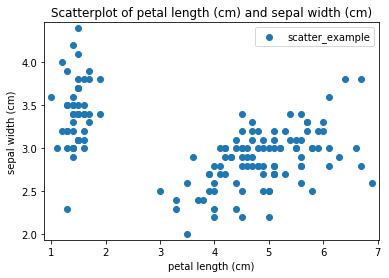
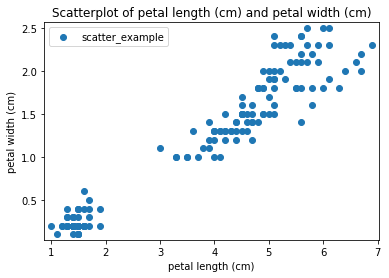
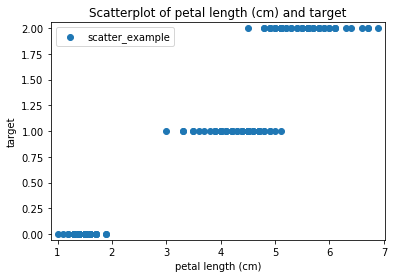
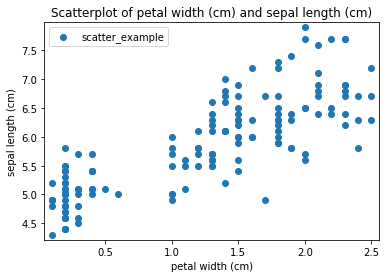
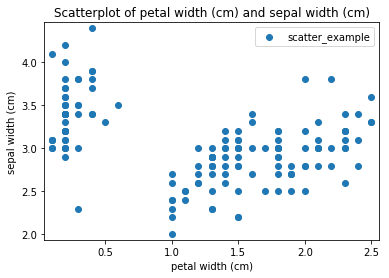
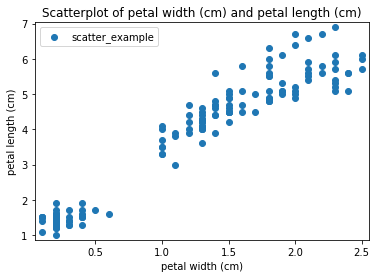
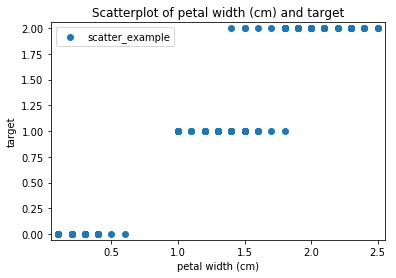
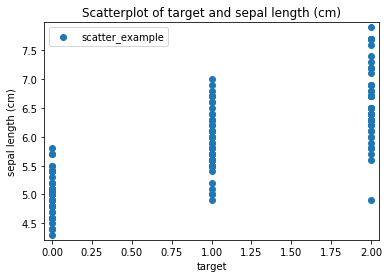
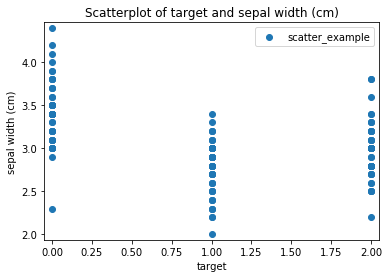
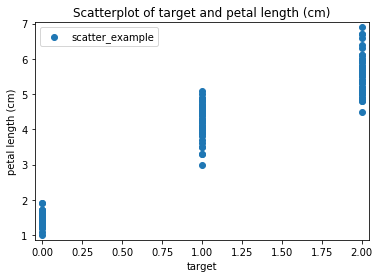
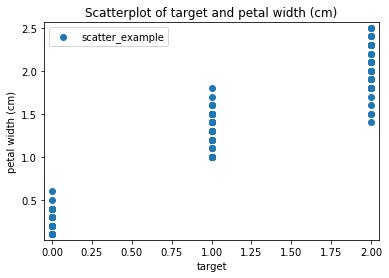
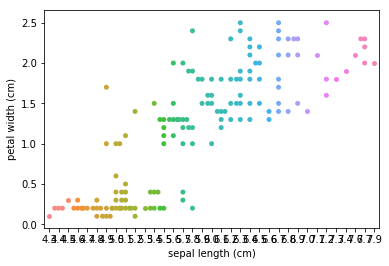
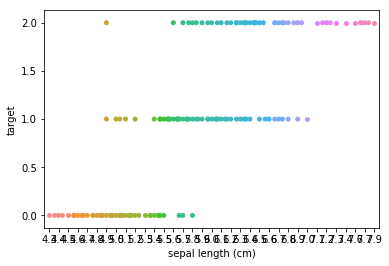
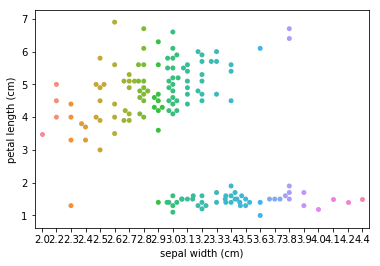
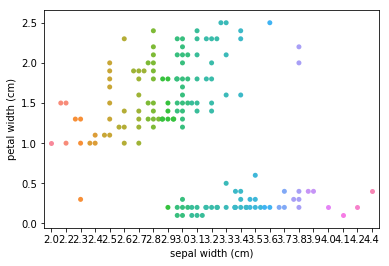
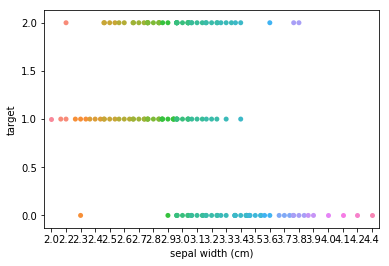
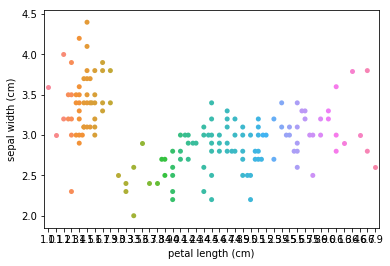
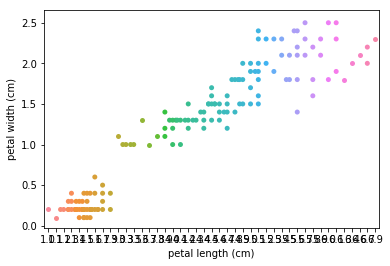
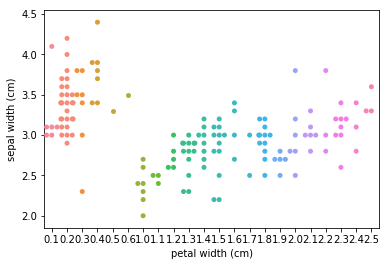
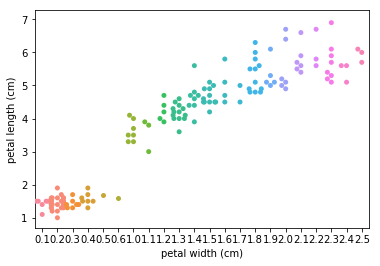
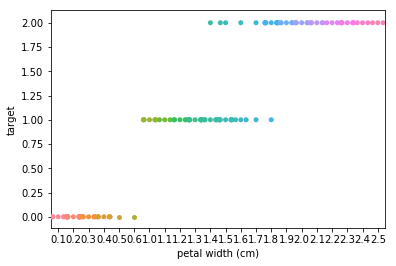
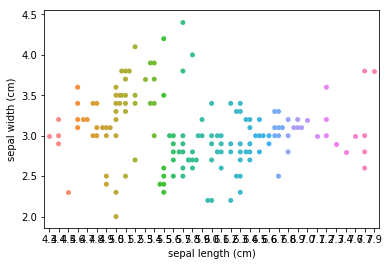
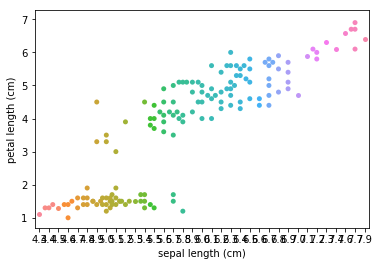
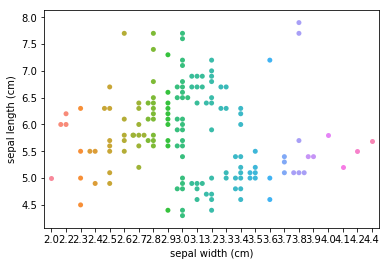
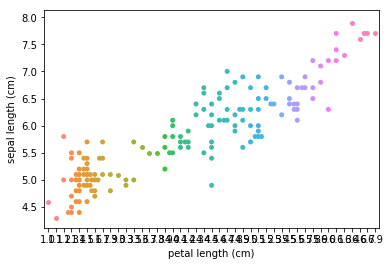
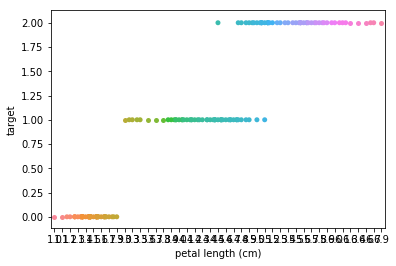
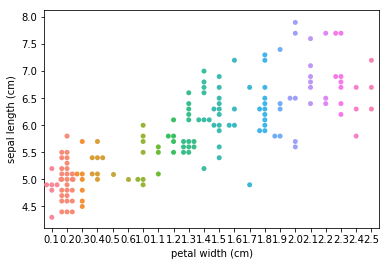
Scatter plots
In [4]:
p = ds.Pipeline()
p.addPipe('read', ds.data.SampleData('iris'))
p.addPipe('scatter', ds.eda.ScatterPlots(), [("read", "df", "df")])
p.transform(name="scatter_example", close_plt=True)
'Drawing diagram using blockdiag'

Transform scatter_example
Scatterplots Transform scatter_example
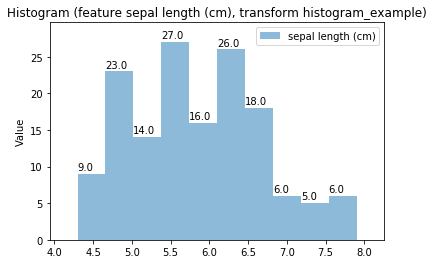
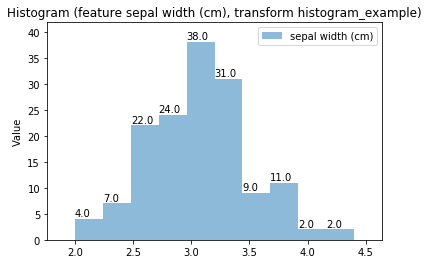
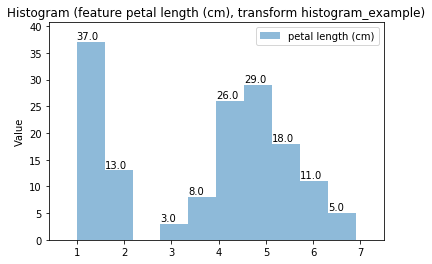
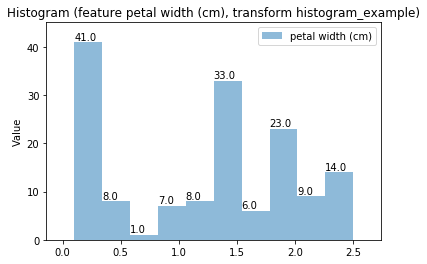
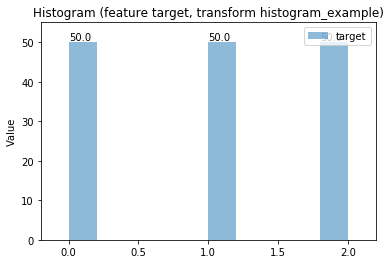
Histogram plots
In [5]:
p = ds.Pipeline()
p.addPipe('read', ds.data.SampleData('iris'))
p.addPipe('hist', ds.eda.Hist(), [("read", "df", "df")])
p.transform(name="histogram_example", close_plt=True)
'Drawing diagram using blockdiag'

Transform histogram_example
Histogram Transform histogram_example
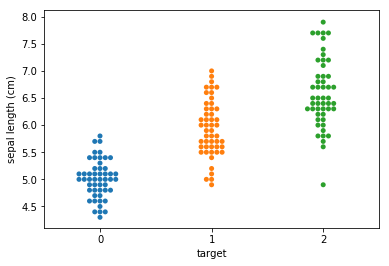
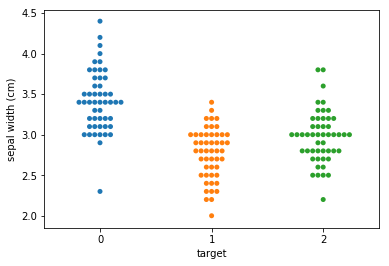
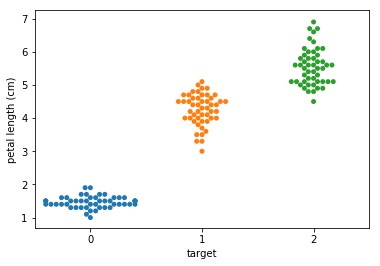
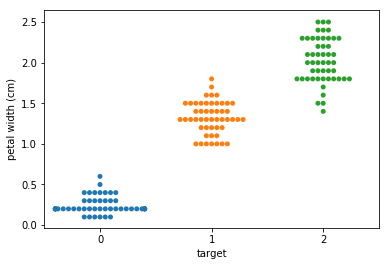
Swarm plots
In [6]:
p = ds.Pipeline()
p.addPipe('read', ds.data.SampleData('iris'))
p.addPipe('swarm', ds.eda.SwarmPlots(), [("read", "df", "df")])
p.transform(name="swarm_example")
'Drawing diagram using blockdiag'

Transform swarm_example
Swarmplots Transform swarm_example


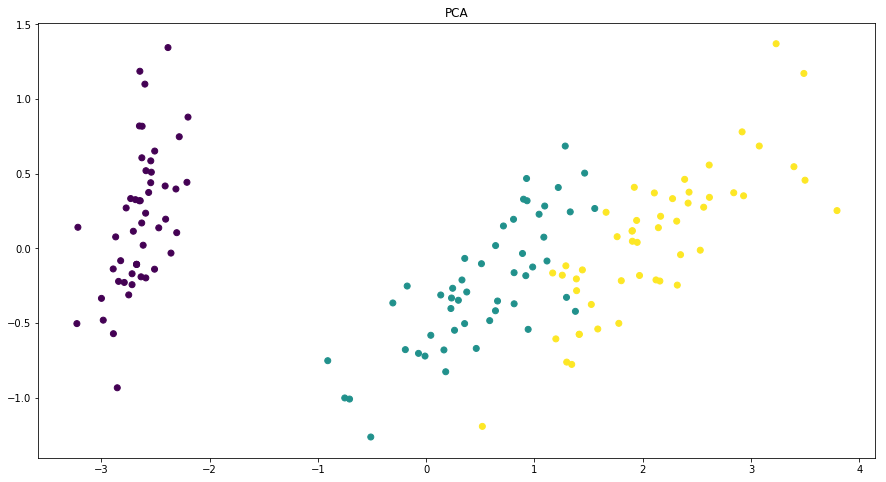
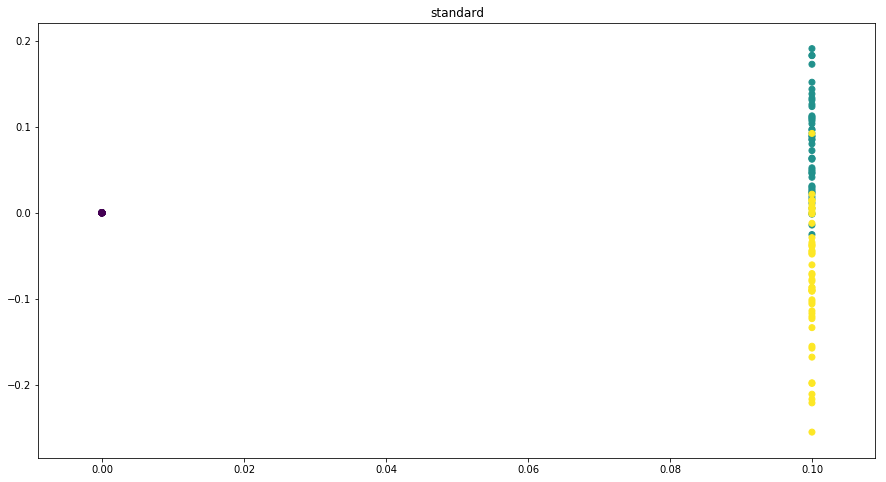
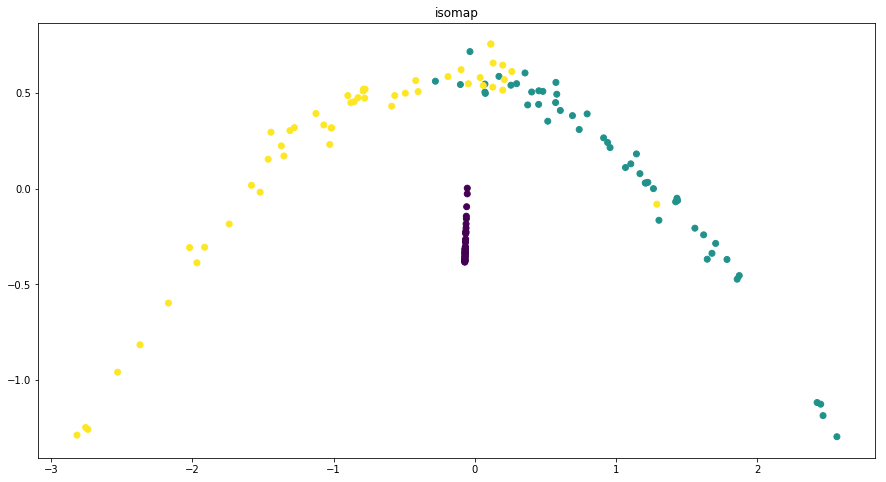
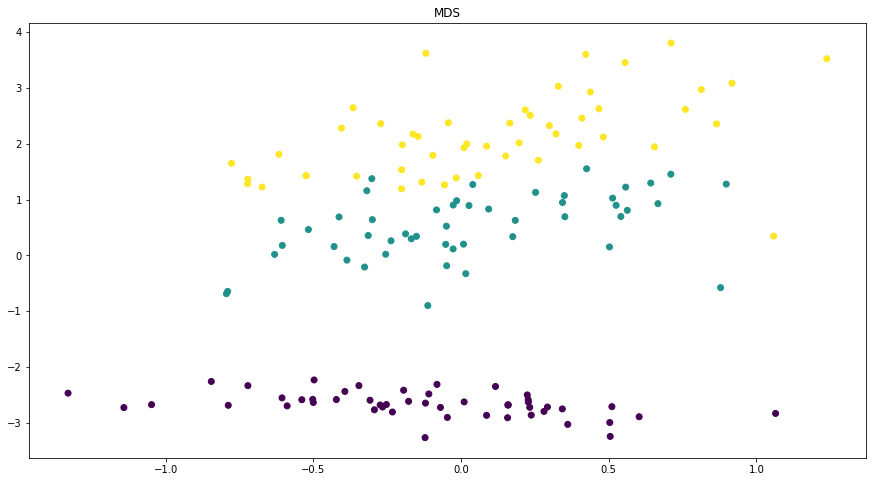
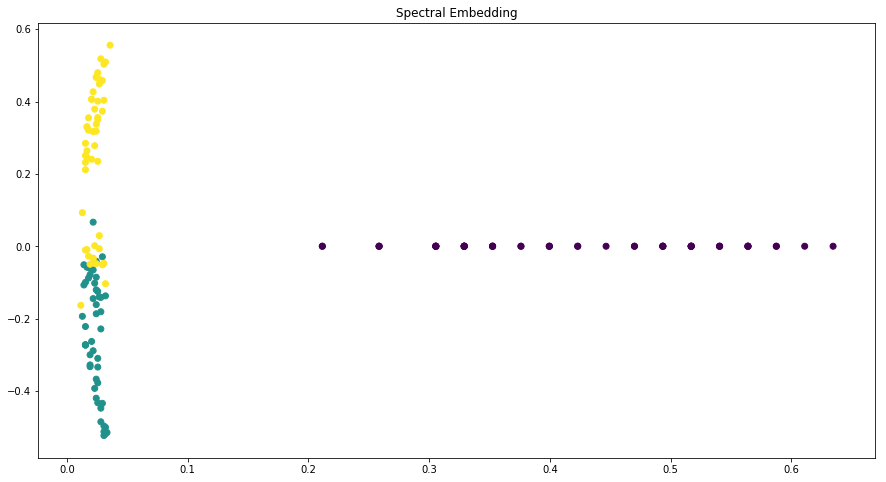
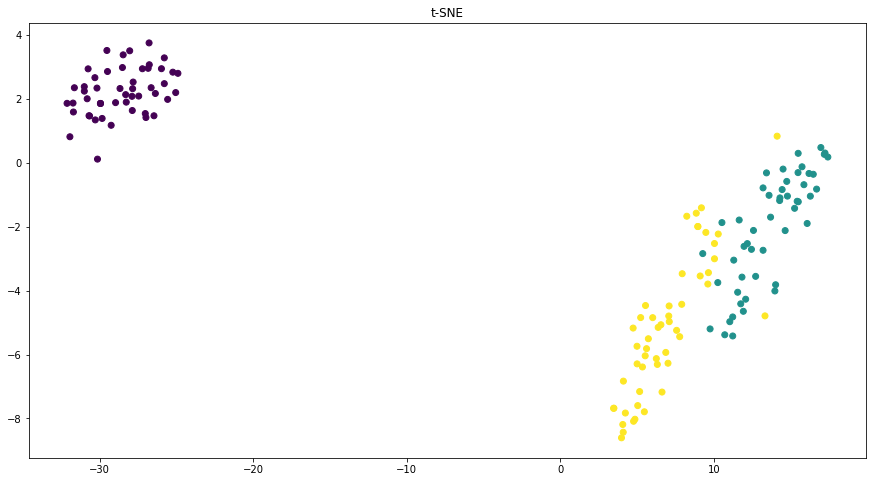
Dimensionality reduction plots
In [7]:
p = ds.Pipeline()
p.addPipe('read', ds.data.SampleData('iris'))
p.addPipe('dimred', ds.eda.DimensionReductionPlots("target"), [("read", "df", "df")])
p.fit_transform(name="dimensionality_reduction_example", close_plt=True)
'Drawing diagram using blockdiag'

Transform dimensionality_reduction_example
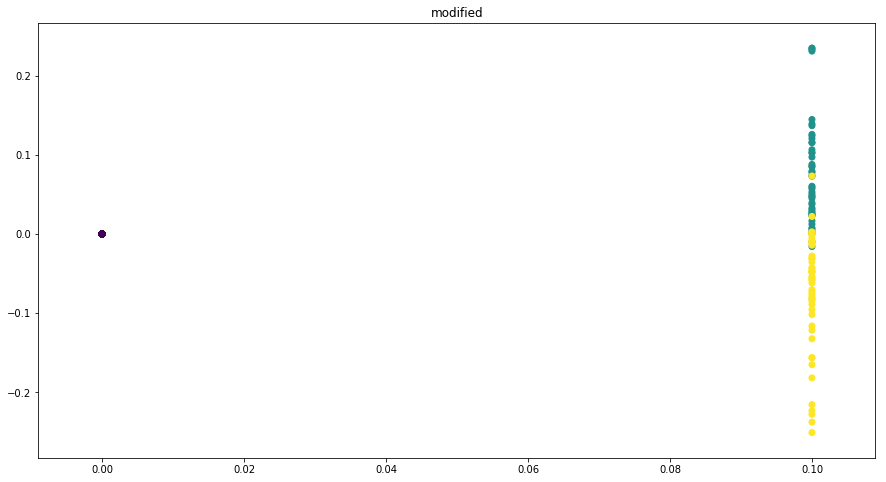
C:\ProgramData\Anaconda3\lib\site-packages\sklearn\manifold\spectral_embedding_.py:234: UserWarning: Graph is not fully connected, spectral embedding may not work as expected.
  warnings.warn("Graph is not fully connected, spectral embedding"
C:\ProgramData\Anaconda3\lib\site-packages\sklearn\neighbors\base.py:371: RuntimeWarning: invalid value encountered in sqrt
  result = np.sqrt(dist[sample_range, neigh_ind]), neigh_ind
Andrews curves plots
In [8]:
p = ds.Pipeline()
p.addPipe('read', ds.data.SampleData('iris'))
p.addPipe('andrews', ds.eda.AndrewsPlot(column="target"), [("read", "df", "df")])
p.transform(name="andrews", close_plt=True)
'Drawing diagram using blockdiag'
Transform andrews
Andrews curves Transform andrews
In [ ]: